for full screen

  n_games           = 1000
  balanced          = FALSE

  df_games          = data.frame()

  for (i in 1:n_games) {
    winning_door    = sample(c("Door 1", "Door 2", "Door 3"), size = 1)
    original_choice = sample(c("Door 1", "Door 2", "Door 3"), size = 1)
    losing_doors    = setdiff(c("Door 1", "Door 2", "Door 3"), winning_door)
    revealed_door   = ifelse(original_choice == winning_door,
                             sample(losing_doors, size = 1),
                             setdiff(losing_doors, original_choice)
                             )
    switched        = ifelse(balanced,
                             ifelse(i <= n_games/2, "Switched", "Not switched"),
                             sample(c("Switched", "Not switched"), size = 1)
                             )
    final_choice    = ifelse(switched == "Switched",
                             setdiff(c("Door 1", "Door 2", "Door 3"), c(revealed_door, original_choice)),
                             original_choice
                             )
    outcome         = ifelse(final_choice == winning_door,
                             "Won",
                             "Lost"
                             )

    game            = cbind(game = i,
                            winning_door,
                            original_choice,
                            switched,
                            outcome
                            )
    df_games        = rbind(df_games,
                            game)
  }
Quantitative analysis
Let’s play!
Simulation
monty(100) |>
  ggplot(aes(x = switched, fill = outcome)) +
  geom_bar(position="fill", stat="count") +
  scale_fill_manual(values = c("#880e0e50", "#396e0a")) +
  labs(x = "\nDid the player switch their choice?",
       fill = "Outcome ", y = "Percent (%) of games\n") +
  theme_minimal() +
  theme(legend.position = "top")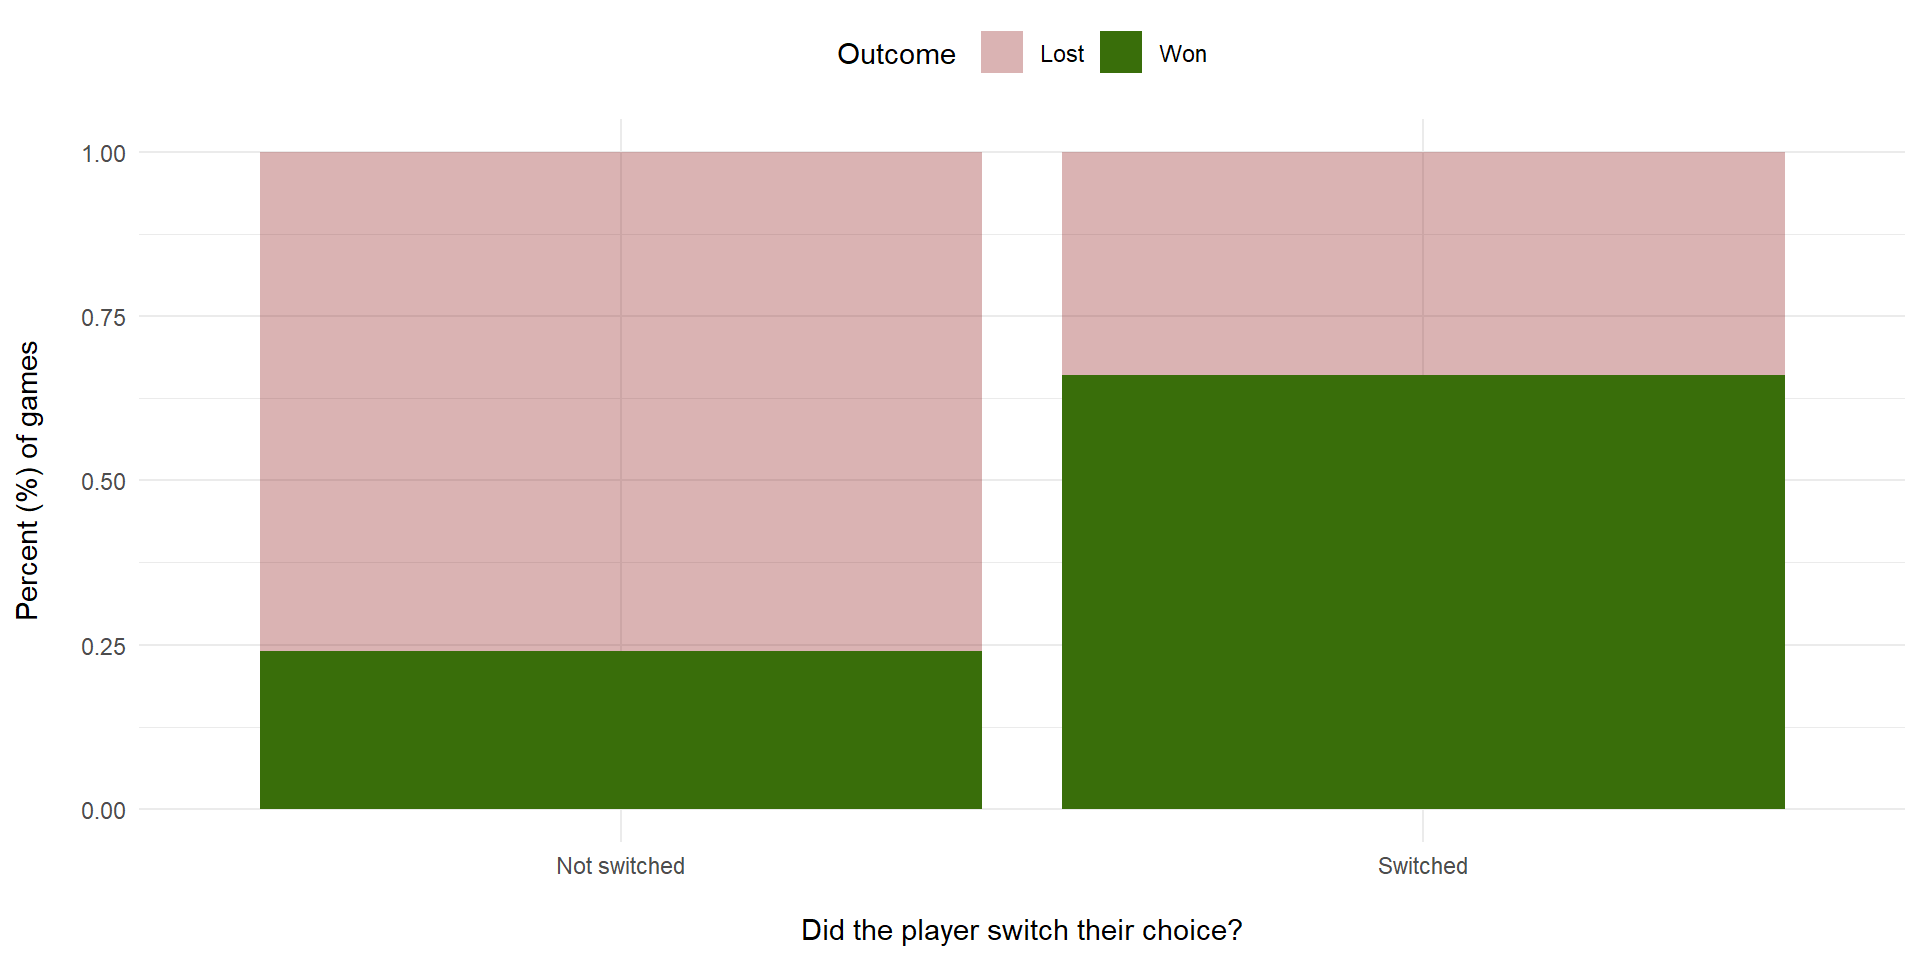
Simulation
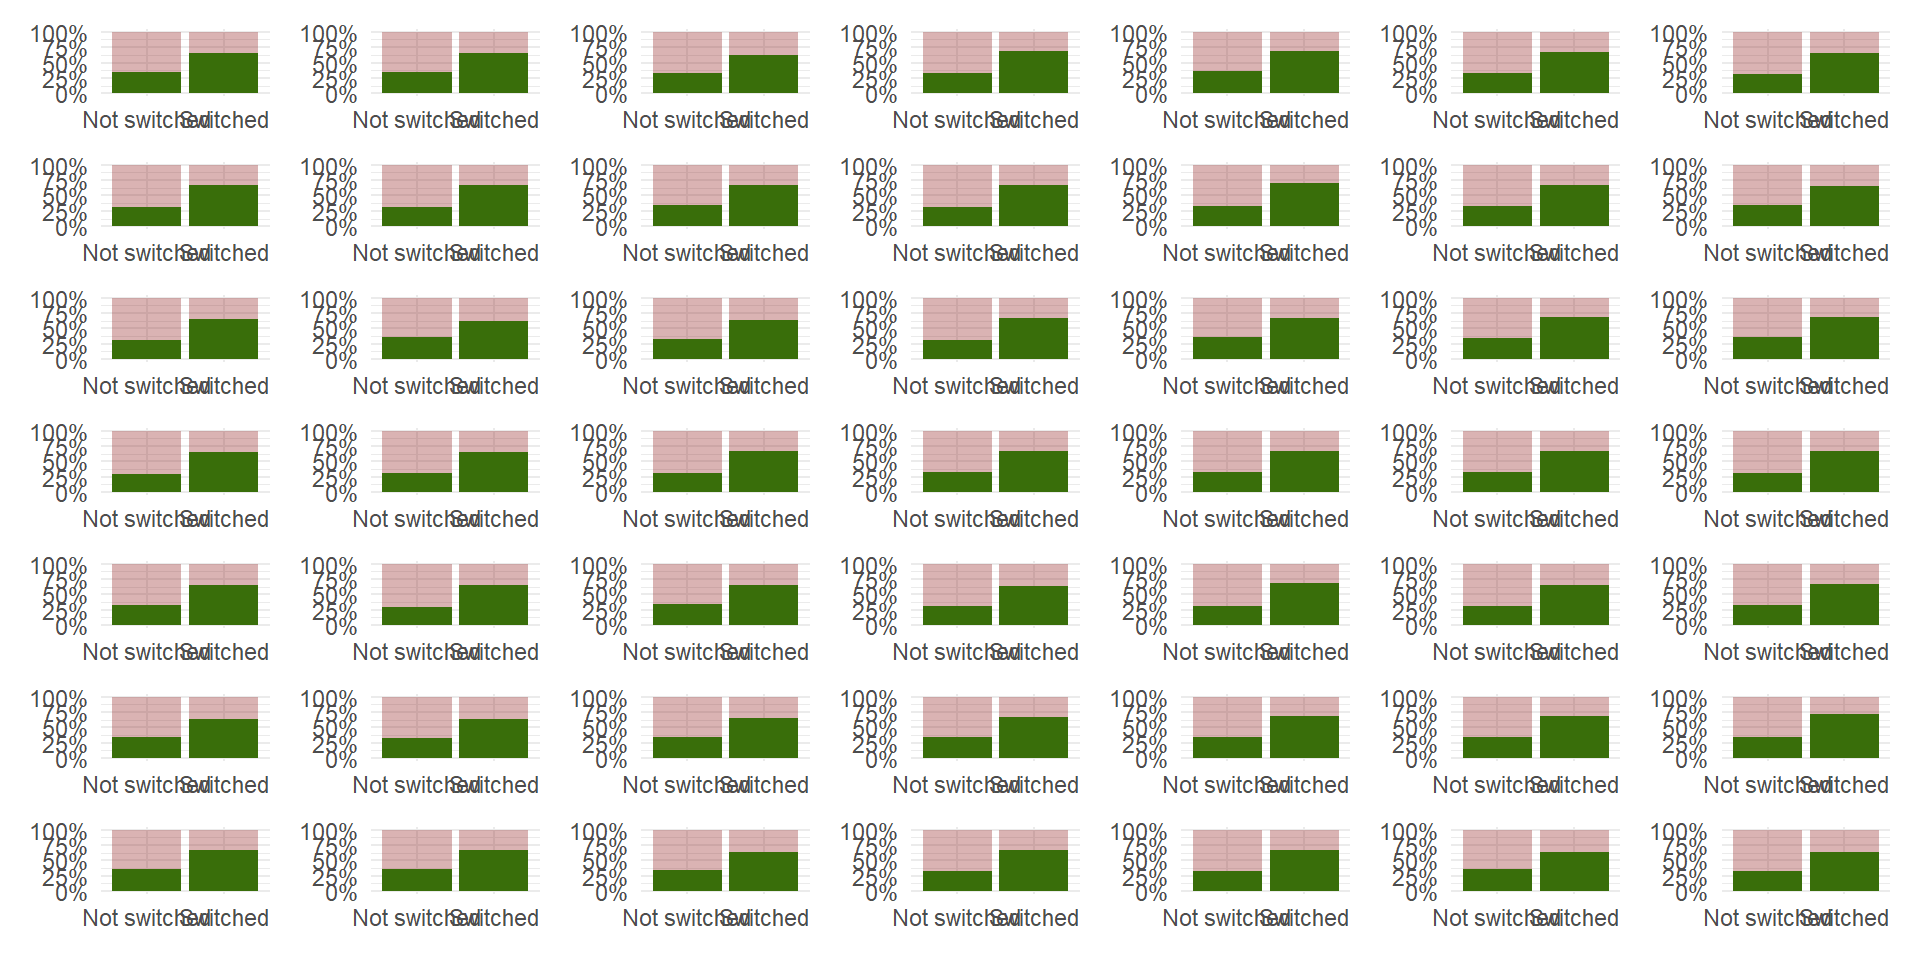
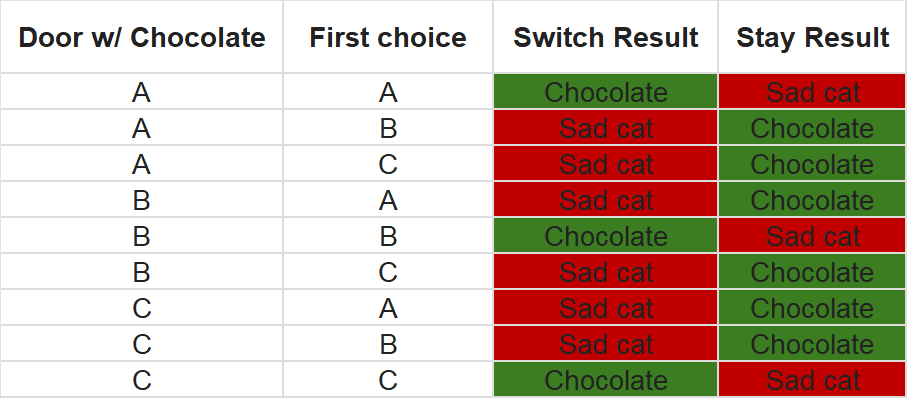
Enumeration
![]()
Enumeration
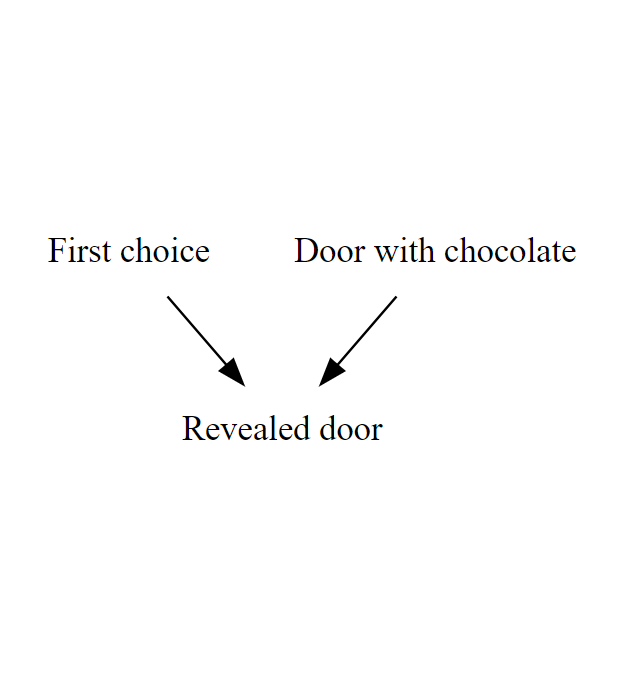
Causal graphs
Bayesian reasoning
Host could not open Door 1 after you chose it — but he could have opened Door 2.
The fact that he did not, makes it more likely that he opened Door 3 because he was forced to.
Thus there is more evidence than before that the prize is behind Door 2.
Any hypothesis that has survived some test that threatens its validity becomes more likely. The greater the threat, the more likely it becomes after surviving.